Wildfire Risks
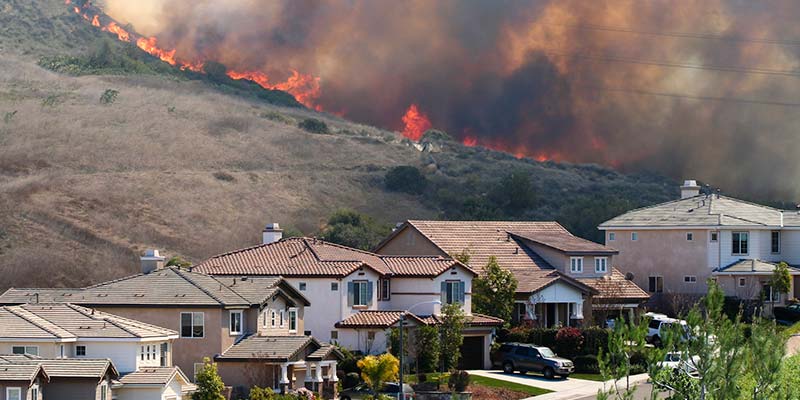
As we close in on the end of summer, wildfires, again, are ravaging parts of the country, with California, Arizona and Oregon bearing the brunt of the pain. This year alone, according to the National Interagency Fire Center, there have been 38,286 fires impacting 3.6 million acres.[1]Wildfires continue to be a significant risk for carriers, causing billions in losses each year.
While some wildfires occur naturally, nearly 85% of fires are caused by human error. These errors include:
- Campfires left unattended
- Sparks generated by the burning debris
- Equipment use and malfunction
- Negligent discarding of cigarettes
- Arson
Several other factors have impacted the severity and frequency of these perils. Researchers point to continued development in high-risk areas. Across the U.S., developers are building more closely to wildland areas in what is called the wildland-urban interface (WUI). Experts estimate that 30-40% of the population live in WUI areas.
States with the largest WUI areas:
- Georgia
- North Carolina
- Pennsylvania
- Texas
States with the greatest number of houses in WUI areas:
- California
- Texas2
As people move into areas that were previously uninhabited, a new fire threat emerges. Finally, global climate change has caused the increased intensity and frequency of wildfires. With rising temperatures and increased droughts, wildfire risks, particularly in the West, have increased.
If you are looking for more information on current or historic wildfire risks, there are a variety of publicly available resources for tracking wildfire activity. Some of the key sites include:
National Interagency Fire Center (NIFC) – All agencies and geographic areas work together under the auspices and direction of the NIFC. NIFC aggregates data on wildfires across the various regions of the US.
National Center for Environmental Losses (NCEL) – NCEL is tasked with tracking severe weather and climate events in the US. They produce a database of cumulative losses by type and state from 1980 to present. The data includes all losses for events over $1B.
Geographic Area Coordination Centers (GAAC) – The US is divided into 11 Geographic Areas for the purpose of incident management and mobilization of resources. Each region has a website that produces detail on fires in the area. State sites, like CalFire, are also linked here.
InciWeb – Incident Information System – This site was created to provide the public with a single source of incident related information. Users can click on a fire and understand things like date of origin, fire cause and actions being taken to control the fire.
Not only do we concern ourselves with safety of our agents and clients, but we also try to make it easier for you to operate in a safer environment. Please review these Wildfire and Wildland Fire Safety Tips to learn about building property protection measures and what steps to take when threatened with a wildfire.
From various training sessions and educational resources such as our Safety Topics, we provide specialized services to help reduce loss potential, loss costs and control unsafe acts and conditions. To access these valuable resources, visit GAIG.com/LP.
An important value of your insurance coverage is the insurer’s ability and reputation for responding to and handling a claim. Great American’s Property & Inland Marine Division is dedicated to offering excellent claims services to insureds. When there’s a claim, the last thing you need to be doing is searching all over for us.
[1] National Interagency Fire Center, Daily Statistics – 8/24/20
Property & Inland Marine Claim Services
AgentPortal.GAIG.com
Toll-Free: 800-584-0835
[email protected]
Property & Inland Marine after house Claims Services (USA only)
Claims Alert Hotline – Crawford and Company
866-354-0148 – Code 15797
After Hours Emergency Restorations/Clean-Up (USA only)
ServiceMaster
800-737-7663